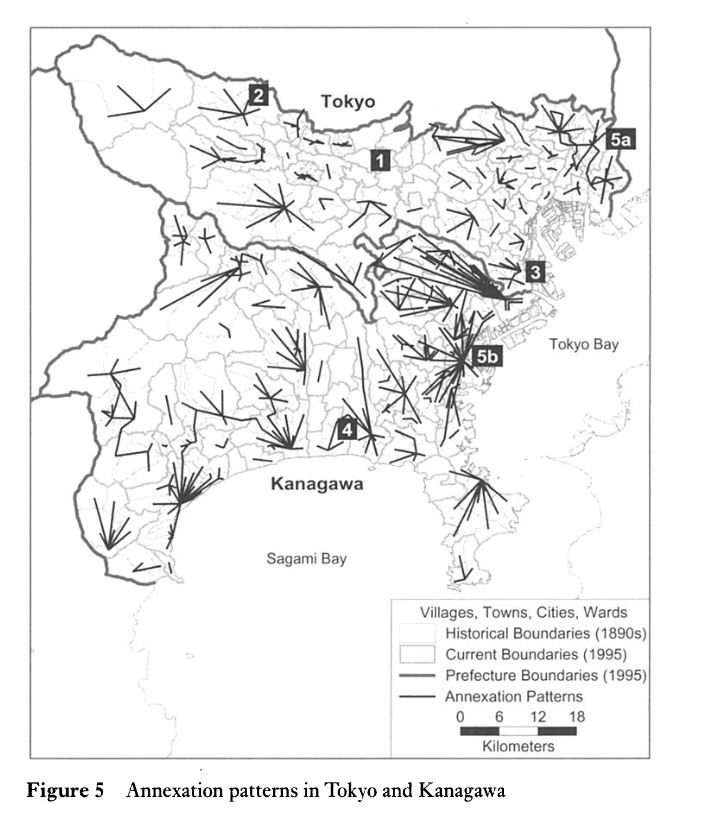
Because I am a historian of place, space is one of the fundamental contexts in which I operate. I felt self-assured going into this weeks Module because I had previously worked as a Geospatial Analyst at the National Geospatial-Intelligence Agency and at other various places during my time in the Air Force. Likewise, I found the articles to be interesting and engaging, it made sense with the vocabulary I had picked up from my work prior. The methodology walk through in Loren Siebert’s “Using GIS to Document, Visualize, and Interpret Tokyo’s Spatial History” was incredible. Figure 5 showing the “Annexation patterns in in Toyko and Kanagawa” on page 560 was a particularly innovative way to show movement in a static image. All in all I felt good about walking into Module 4!
But of course, dear reader, as per usual attending class brought frustration (in a good way!) At its base I like QGIS, the software is hardy and the application of it will surely be useful, but getting beyond the learning curve in class was difficult for me. Especially working off a laptop without a mouse. I had supposed my previous experience would somehow translate to new software, but quickly realized that what we were doing was fundamentally different than what I did in my old career. Where my job prior had been using historic imagery to anticipate the future, my new understanding was to uncover patterns from the past and interpret meaning as it related to that historic context. This is a significant change. Appreciating the use of GIS outside of my earlier career is, in many ways, a rehabilitation of the methodology for me. Rather than using it in a way that is so associated with military functions (often ending in death and destruction), this shift towards using GIS to interpret human meaning and patterns for historic research purposes is sublime. Is that too intense a word? I do not think so, it feels like a recovery of a tool that I had associated with negative emotions. So I’m pleased to be able to pick this tool back up and cultivate something other than an “intelligence product.”
Having a discussion with Dr. Otis about data display really brought this point home. I was asking her about moving displays to show change over time or perhaps a sliding map (similar to how Annabelle’s excellent blog post this week [seen here]) and while Dr. Otis did not discount these methods she shared with our group some other options such as small multiples.

The above image I took from a Cartographer’s blog found here.
As Dr. Otis explained the merits of a static map, I found myself agreeing wholeheartedly. It allows the reader entry into the data in a more logical way. The reader can follow the information with their eyes on their own time and not be merely dazzled by movement. That’s not to say a moving map or GIS image has no place, but I think maybe doing so in a more restrained fashion could allow that one portion to be more powerful and significant rather than overwhelming the reader with movement and flash. What I am taking away from this lesson is that learning GIS will be both time consuming and necessary (at least for my focus.) I want to be able to show change over time in a way that focuses on placeful-ness and references key physical/geographic features. I also want to incorporate using small multiples somehow and I would like to find the best way to show relationships between humans and the landscape. Going back to the article by Siebert and her GIS visualizations, it makes me want to think cleanly and creatively about displaying data. To that end I think reading broadly and looking at how other historians are utilizing GIS will help me glean ideas on best practices. I am also looking forward to seeing everyone’s end of class digital projects and how or if they use GIS data or visualizations!
—————————————————————————————-
If you’re interested here is how the USAF uses geospatial data:
6 replies on “More like Geez-IS”
I really like how you compare the plague data map with how the Air Force makes maps.
The main difference between the two is that the former was made to track data from the past.
The Air Force uses that data to track enemy positions in the present.
They have to take into account several factors, like the enemy changing positions.
I’m a complete newbie when it comes to GIS, so it is nice to hear from people with experience in this area.
Josh
Hi Jess,
I really valued your expertise and overall familiarity with the topic this past module! Not only has it given me a better understanding of what you did while in the Air Force, but it also showed how valuable tools like GIS, or even Google Earth Pro could be in our future projects. I think QGIS and all of it’s quirks could help with visualizing our data in a way that would be more accessible to a wider audience as well as pave the way for more contemporary ways of visualizing data to come about.
Jess,
I actually laughed out loud when I read your title. Nice one.
I was eavesdropping on your conversation with Dr. Otis about moving images vs. small multiples, and I have to admit that I’d never considered it before. I’ve used both in my past work, though the decision to shift to small multiples in the military is usually driven by two things – file size limitations and/or slide count limits. Both could result in reducing a moving image to critical snapshots or turning four slides into a one-slide quad chart. I think the argument Dr. Otis made is sound, though. Default to small multiples or some other static visual and be sparing, cautious, and deliberate about using a moving image in historical work. If it’s something you want to try and tackle in our group work, I’m on board.
Chris, did you find your imposed presentation limits created better arguments? Say, compiling 4 connected slides into one with a potential Venn like unifying image chunked the information into clearer categories? Did you ever encounter a presentation that used both?
Kacey, that’s a great question. My one-word response is “rarely.” More often than not, you’d see 4 slides of information shrunk down into a quad, and if there was detailed textual information, you’d often needed a magnifying class to read it. It achieved the objective of reducing file size, but only occasionally would I say it induced clarity through streamlining.
To bring it back to our class and Dr. Otis’s argument, however, there’s a LOT you take for granted when you present historical information in a moving image. By using small multiples or a similarly static visual presentation, you ensure that the agency over the time to digest is firmly in the hands of the reader.
Jess I’ve spent the week contemplating this. I keep coming back to a series of moving images that also include static/snapshots of comparative data over the same period of time. This would allow the viewer to see how movement into and out of a space occurred, as well as the multiple ways those changes impacted the space and the people within/around it.